Frappe Number Cards and Dashboards Chart
Visual information of the data is a key to making decisions easy and quick. Number Cards and Dashboard Charts in Frappe can help you to analyse your business.

Number Card
Let's make it easy for everyone to develop a number card with complex requirements.
In frappe you can create three type of Number card
- Document Type
- Report
- Custom
Document Type allows you to fetch the perfect number from a specific document. Additionally, you can perform operations such as sum, average, minimum, and maximum on the numbers.
Report allows you to fetch numbers from any report. Based on the existing report, you can perform operations on the selected column of the report.
Custom It can be used for complex requirements, as it allows you to write your custom logic in your Python API and fetch dynamic data.
Let's Learn About Custom Number Cards
Quickly search a Number Card List and Add New
Input a required details :
Are you thinking about Api? Don't Worry !
Once you save the document system will create a folder and json file in your custom app.
Write your Api in any python file and mention a path of that Api in "Method" field.
Example:
    my_app.my_app.number_card.total_outgoing_bill.total_outgoing_bill.get_number_card_data
Here "total_outgoing_bill" is name of the number card
API - 1:
    @frappe.whitelist()
    def get_number_card_data():
        return {
            "value": 50,
            "fieldtype": "Currency",
        }
- The function get_number_card_data returns a value in a dictionary, which contains two keys.
- The key 'value' is required to display a number on the number card.
- The key 'fieldtype' is responsible for representing the type of the value.
API - 2:
    @frappe.whitelist()
    def get_number_card_data():
        return {
            "value": 50,
            "fieldtype": "Currency",
            "route_options": {"from_date": "2023-05-23"},
    	"route": ["query-report", "Permitted Documents For User"]
        }
In API - 2, there are two additional keys in the returned dictionary:
1. route_options: This key allows you to apply default filters to the report when the number card is clicked. In this case, a filter is set for from_date: "2023-05-23".
2. route: This key specifies the report name and type. Here, "Permitted Documents For User" is the name of the report.
The route_options key applies a filter to the report, while the route key redirects to the relevant report from the number card. When a report contains proof of the data displayed on the number card, clicking on the number card redirects the user to the appropriate report, applying the default filters set in route_options.
Dashboard Chart
The Dashboard Chart offers multiple chart type options for creating a chart. However, one of the options, 'Custom' has no limitations on pulling data for the chart. you can write your python script and fullfill your complex requirement.
Use awesome bar and search "Dashboard chart List".
There is one field "Chart Source" ( To create a chart source select a module)
Once you save a chart source system will create folder and files in a selected custom app module
Check there should be one JS file in folder
Folder Structure in your custom appAssume that the chart source name is "My Dashboard Chart", then the folder structure will be as mentioned below:
> my_app
    > my_app
        > my_app
            > dashboard_chart_source
                > my_dashboard_chart.js
                > my_dashboard_chart.json
Create a JS file a my_dashboard_chart.js file if not exist and add a code as mentioned bellow
frappe.dashboards.chart_sources[ "My Dashboard Chart" ] = {
    method: "path/of/the/Api",
    filters: [
		{
			fieldname: "from_date",
			label: __("From Date"),
			fieldtype: "Date",
		},
               {
			fieldname: "to_date",
			label: __("To Date"),
			fieldtype: "Date",
		},
	]
};


//Replace a "My Dashboard Chart" with Actual chart sourch name
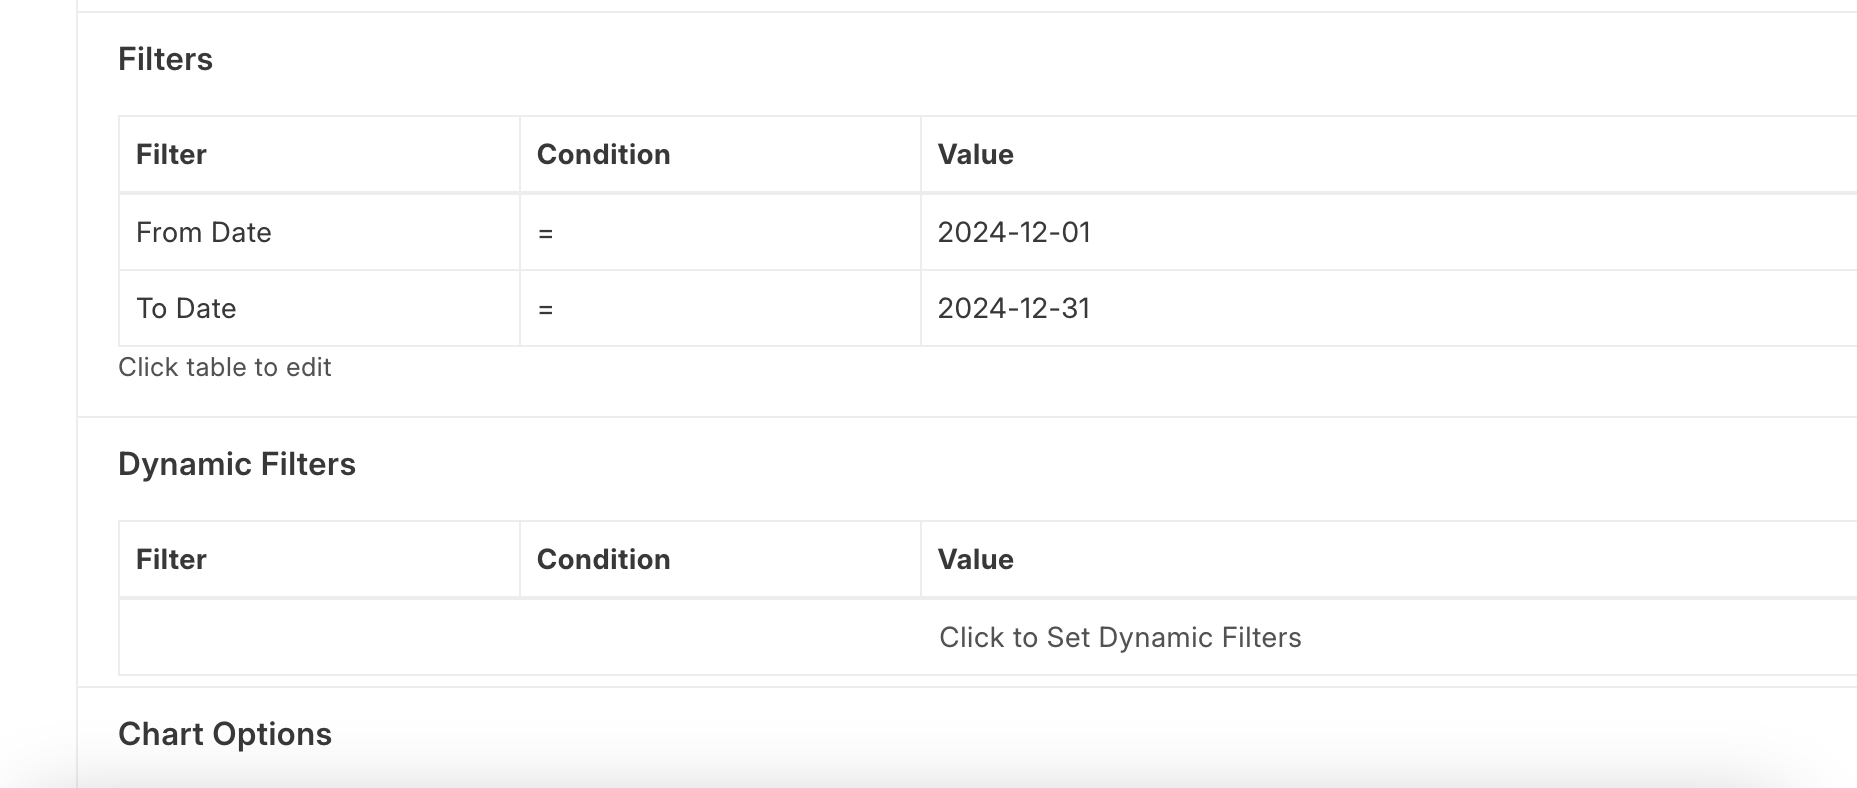
Filters which you have mentioned here that will be apprear here on frontend side.

Let's learn about Api!
@frappe.whitelist()
def get_data(filters):

    return {
        "labels": ["A", "B", "C"],
        "datasets":
        [
            {"values": [23, 45, 56] , "name" : "Demo1", "chartType" : "line"},
            {"values": [12, 40, 60] , "name" : "Demo2", "chartType" : "bar"},
            {"values": [67, 30, 20] , "name" : "Demo3", "chartType" : "bar"}

        ],
        "type": "axis-mixed",
     }
Result

The beauty of this feature is that you can add multiple types of charts in a single chart.
In Api you can see that there are some Key:
- Key labels are a required parameter to show X-axis values.
- Key datasets contain a list of datasets. You can mention multiple values with different types of charts in this key.
Please give me help how to apply in dynamic filter section in fromdate and todate in forntend